Considerations When Designing Map Tiles for 3D Views
The ArcGIS JS 4.x API allows us to create amazing 3D views within the browser. To get the best from these views we need to adapt established cartographic practices. This article examines one aspect of a 3D view, MapTiles, how they appear and design considerations.
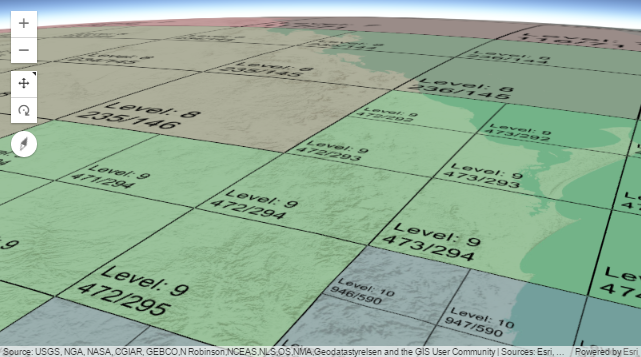
In a 3D view, tiled map services can appear to render inconsistently when used for cartographic representation or in a base map. The tile levels will vary as scale varies across the scene. When the scene is tilted the tiles in the foreground will be displayed from a larger scale zoom level while and shift progressively smaller scale tiles in the background. In the figure below the map tiles are symbolized by level, to show how different levels can be displayed together at a variety of display scales.

Illustration of MapTiles in a 3D Scene, showing variation in view scales, and tile levels
From the illustration note the following impacts in the display of map tiles:
- More than one tile level may be displayed at any one time
- The display size of the map tiles will vary throughout the scene
- A tiles display height will be less than its width when the scene is tilted
- Orientation will vary across the display and north may not be at the top of the map
All of these items need to be considered when creating a tiles map service that will be used in 3D.
Thinking about Display Scale
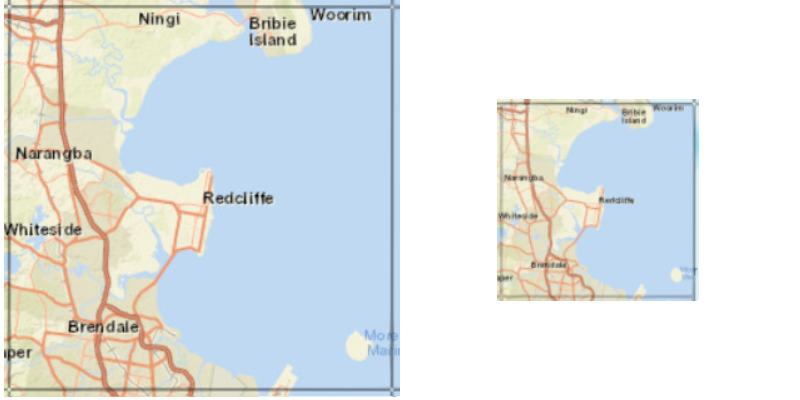
Map Tiles will be displayed in a 3D view at a range of scales. For rendering purposes it may be better to refer to this scale as the Nominal Scale.

Example display scale range for a tile, Level: 10, Scale: 1:577790, Display Scale Range: 1:480603 - 1:961332
The implication of this is that each level should be designed to be used between the max and min display scales. In the ArcGIS JS API 4.x, the observed display scale range is approximately 83% - 166% of the scale for each level as listed in the following table.
| Level | Nominal Scale | Approx. Display Scale Range |
|---|---|---|
| 0 | 591657527.6 | 1:490000000 - 1:980000000 |
| 1 | 295828763.8 | 1:250000000 - 1:490000000 |
| 2 | 147914381.9 | 1:120000000 - 1:250000000 |
| 3 | 73957190.95 | 1:61000000 - 1:120000000 |
| 4 | 36978595.47 | 1:31000000 - 1:61000000 |
| 5 | 18489297.74 | 1:15000000 - 1:31000000 |
| 6 | 9244648.869 | 1:7700000 - 1:15000000 |
| 7 | 4622324.434 | 1:3800000 - 1:7700000 |
| 8 | 2311162.217 | 1:1900000 - 1:3800000 |
| 9 | 1155581.109 | 1:960000 - 1:1900000 |
| 10 | 577790.5543 | 1:480000 - 1:960000 |
| 11 | 288895.2771 | 1:240000 - 1:480000 |
| 12 | 144447.6386 | 1:120000 - 1:240000 |
| 13 | 72223.81929 | 1:60000 - 1:120000 |
| 14 | 36111.90964 | 1:30000 - 1:60000 |
| 15 | 18055.95482 | 1:15000 - 1:30000 |
| 16 | 9027.977411 | 1:7500 - 1:15000 |
| 17 | 4513.988705 | 1:3700 - 1:7500 |
| 18 | 2256.994353 | 1:1900 - 1:3700 |
| 19 | 1128.497176 | 1:940 - 1:1900 |
| 20 | 564.248588 | 1:470 - 1:940 |
| 21 | 282.124294 | 1:230 - 1:470 |
| 22 | 141.062147 | 1:117 - 1:230 |
| 23 | 70.5310735 | 1:59 - 1:117 |
The implication of the above is that we need to consider the symbology and fonts used when creating a Map Tile Service. How will they display at the smaller end of the scale range?
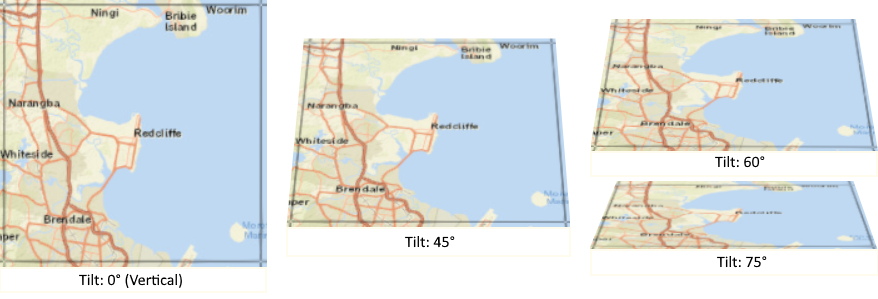
The legibility of symbols and fonts is further reduced once tilt is introduced to the view. The tiles scale looking at a view from bottom to top will be less than the width as shown in the figure below.

Example tile displayed at a range of tilts, demonstrating the impact on legibility
To account for the complexities of scale described above it is recommended that when designing a tile service for use in 3D use the following guidelines:
- Design the tile level for the lower end of the scale
- Be more selective with the amount of content displayed
- Use simpler, cleaner symbology for polylines
- Consider increasing line and marker size by 20-30% as a compromise
- Be more selective with the use of labels
- Increase the font and size by 20-30% as a compromise or
- Move labels, into a separate feature layer with bill-boarded labels
Clash of Tile Levels
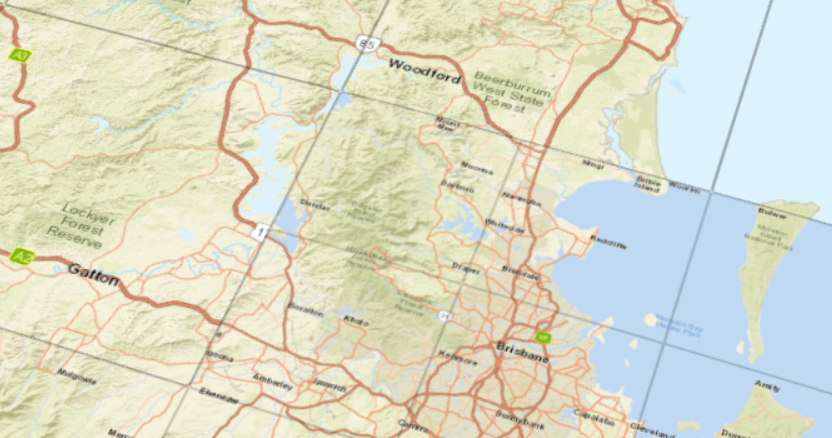
The first figure in this article demonstrated that a number tile levels may be displayed along side each other. When designing a tiled map service consider how these levels will appear against each other to ensure they do not clash or mislead the user. The following figure shows some of the common issues encountered in the transition between tiles.
 Example of mixed tile levels
In the illustration above the following issues can be seen as tiles progress from one scale to another:
- Change in polygon fill at different levels
- Major roads appear to step down as they transition between scales
- Labels sizes are inconsistent across the view, small towns may get larger labels than capital cities
- Labels and markers truncated as they cross tile boundaries
A 3D view can draw the user in, inviting exploration, navigating around a landscape in a more immersive way. As a user navigates, the tiles will be constantly changing and updating, sharp changes in symbology will make the view appear to flicker. This issue will be more apparent when tiles are used in VR/AR where arbitrary changes can distract and disorient a viewer and provide an unpleasant experience.
The eye and brain do an amazing job at recognizing edges and patterns. Arbitrary changes between tile levels can be misinterpreted as changes in data. The brain then needs to further process this information and reinterpret what has been seen. This additional cognitive load can distract from the usability and perceived quality of a 3D scene.
Polygon features that are not visible at some scales may be interpreted by the user as an incorrect shape. Similarly if different fills are used at different levels a user may see two polygons when there is in fact only one. The following steps can reduce the impact on polygon features:
- Use a consistent fill for polygon features
- Use a simple solid fill with transparency rather than a cartographic fill
- Consider how polygon features will appear if using a scale range
- Display discrete polygons such as parks or urban areas at a wider range of scales
Linear features such as roads can appear to step or stop at tile boundaries, implying ether a change in road category or termination. The following steps can reduce the impact on linear features:
- Use simple solid line symbols
- Graduate a the line symbol with each tile level, for roads try a 60% increase for each tile level
[Need to cover....
- AR/VR
- Roads
- Recommendations ]
Acknowledgments
MacEachren, Alan M. How Maps Work: Representation, Visualization, and Design Guilford Press, 2005
Tile sources: Esri, USGS, NGA, NASA, CGIAR, GEBCO,N Robinson,NCEAS,NLS,OS,NMA,Geodatastyrelsen and the GIS User Community | Moreton Bay Regional Council, Esri, HERE, DeLorme, FAO, USGS